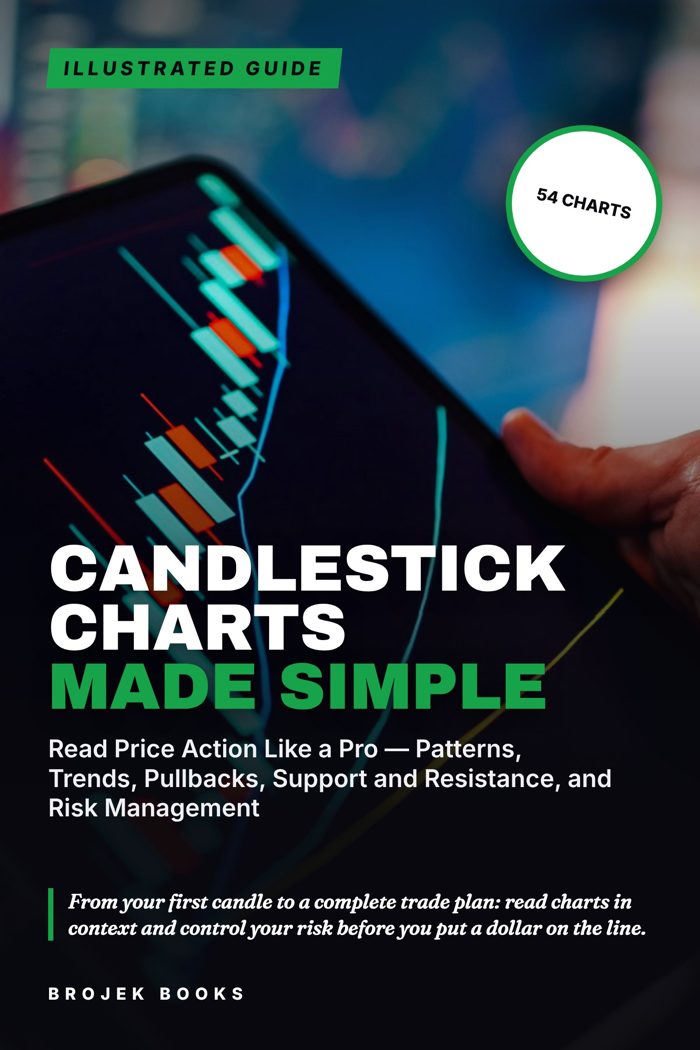
Candlestick Charts Made Simple
Read Price Action Like a Pro — Patterns, Trends, Pullbacks, Support and Resistance, and Risk Management
From your first candle to a complete trade plan: read charts in context and control your risk before you put a dollar on the line.
What you get
- Read any candle: open, high, low, close, body, wicks and who won the session
- 20+ one-, two- and three-candle patterns, each with a dedicated chart
- Trend structure, trendlines, channels, support, resistance and supply/demand zones
- Real breakouts vs. false breakouts, with volume clues
- Pullback and throwback trades with entry, stop and target in dollars
- Position-sizing formula, R-multiples, risk-to-reward and expectancy
- Trading journal template, pre-trade checklist and signal scorecard
- 12 exercises with answers, A-to-Z glossary and a 4-week study plan
You open a stock chart and see a wall of green and red bars. Is that a signal, noise or a trap? This illustrated guide teaches you to read price action the right way: starting with a single candle and ending with a complete trade plan that has an entry, a stop, a target and an exact position size.
Inside are 16 chapters and 54 charts drawn specifically to explain each idea. You learn candle anatomy (open, high, low, close, body and wicks), timeframes, and more than 20 classic one-, two- and three-candle patterns: doji, hammer, hanging man, shooting star, marubozu, engulfing, harami, piercing line, dark cloud cover, tweezers, morning and evening stars, three white soldiers, three black crows and the tri-star.
More importantly, you learn the context that gives those patterns value: trend structure, trendlines and channels, support and resistance, breakouts and false breakouts, supply and demand zones, volume, moving averages, gaps, earnings risk and multiple timeframes.
The pullback chapter walks through long and short trades with entry, stop and target in real dollar amounts, plus a trade that fails, because that happens too. The risk chapter gives you the position-sizing formula with worked examples from $5,000 to $100,000 accounts, R-multiples, risk-to-reward, expectancy and the US rules every trader should know (the pattern day trader rule and its 2026 overhaul, T+1 settlement, wash sales).
You also get a trading journal template, a pre-trade checklist, a signal scorecard, 12 exercises with answers, an A-to-Z glossary and a 4-week study plan.
Educational content only. Trading involves substantial risk of loss; patterns are probabilities, not guarantees.
What's inside
- Before You Start: What This Book Will (and Won't) Do for You
- Anatomy of a Candle: Four Prices, One Story
- Single-Candle Signals: Doji, Hammer, Shooting Star and Friends
- Two-Candle Patterns: Engulfing, Harami, Piercing Line and Tweezers
- Three-Candle Patterns: Stars, Soldiers, Crows and the Tri-Star
- Trend: Higher Highs, Lower Lows and the Lines That Matter
- Support and Resistance: Where Price Remembers
- Pullbacks and Throwbacks: Buying the Dip With a Plan
- Volume: The Fuel Behind Every Move
- Moving Averages and Gaps: Trend Filters and Price Jumps
- Multiple Timeframes: Zoom Out, Then Zoom In
- Risk Management and Position Sizing: The Part That Keeps You in the Game
- Trading Psychology and Your Trading Journal
- Practice Exercises (With Answers)
- Glossary: Candlestick and Trading Terms From A to Z
- Your Pre-Trade Checklist and 4-Week Study Plan
Read a sample
The pullback is the most used concept among trend traders and one of the most misunderstood. Let's slow down and do it properly. A pullback is a temporary move against the trend before the trend resumes. In an uptrend, it is the dip after a rally leg. In a downtrend, it is the bounce after a drop leg. Remember the zigzag from Chapter 6: every zag against the trend is a pullback. The logic of trading pullbacks: instead of buying at the top of a burst of excitement, you wait for price to breathe, come back to an area of interest, and show signs of turning back up. You get a better price and, more importantly, a much tighter stop. ... The trade makes sense not because the stock "will go up" (nobody knows that) but because if it's wrong you lose about $200, and if it's right you make about $400. At that ratio, you can be wrong more often than you're right and still come out ahead over many trades.
Questions
What format is it?
A PDF ebook you download right after purchase. It works on phones, tablets, Kindle apps that open PDFs, and computers.
How do I get it?
After checkout you get a download link by email and on the confirmation page.
Who wrote it?
Brojek Books, the publishing imprint of Brojek Games (brojekgames.com).
 The AI Toolbox
 500 AI Prompts That Actually Work
 Investing for Beginners
 The Debt-Free Blueprint
 Conversational Spanish in 30 Days
 Unhooked
 Grow Your Own Food
 World Travel Manual